National accounts
Revelations about our structurally weak economy
Are we in a recession? Depends on what you mean by recession
Some economists expected the December quarter national accounts, released on Wednesday, to show a decline in GDP, but GDP growth came in ata 0.2 percent for the quarter and 1.5 percent for the year. Households have been holding back, voluntarily and involuntarily, while government spending and a fall in imports have kept the GDP just in the black. John Hawkins of the University of Canberra provides an informative interpretation of the national accounts in a Conversation contribution: Chalmers changes tack as economic growth sinks to a new post-pandemic low.
By the most commonly-used definition of a recession – two quarters of negative GDP growth – we aren’t in a recession. Our last “recession” by this measure was in 2020 when we locked down in response to the Covid-19 epidemic.
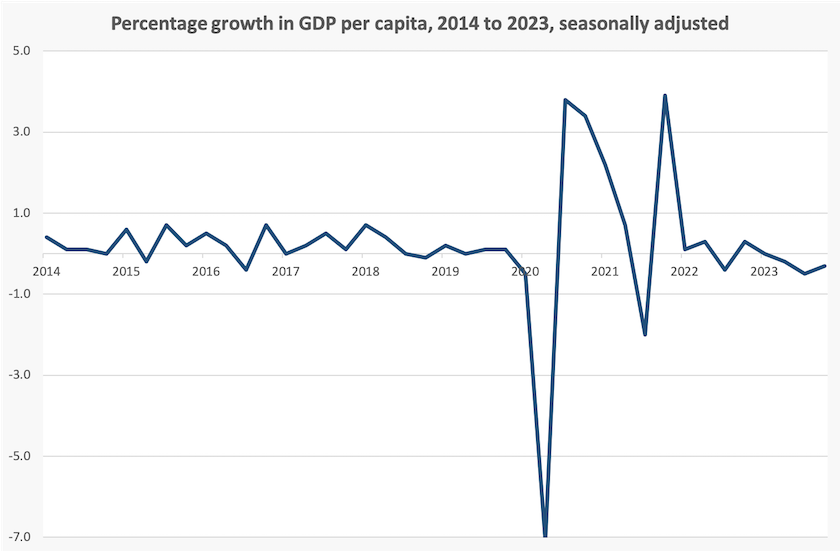
But if we look at the change in GDP per capita, a measure that nets out population growth and is closer to our lived experience, December was the third consecutive quarter in which the line went below the axis, as shown in the graph below. In fact a look at the line for the years leading up to Covid-19 confirms that our economic performance has been miserable for some time.
Writing in The Conversation, just before release of the figures, Peter Martin takes us one step closer to our lived experience where he shows that real household disposable income per capita – what we have left after we’ve paid taxes – has been falling for two years. He calls it “the biggest dive in living standards in half a century” in his article Prepare to hear about an “official recession”. Unofficially, we’ve been in one for some time. He reminds us that there is no such thing as an “official” recession, however.
The ABC’s Gareth Hutchens brings in another contending definition of “recession” based on the rate of increase in unemployment. In his article If we could take politics out of economic stimulus programs, what would happen? he refers to “Sahm’s Rule”, named after the US economist Claudia Sahm, who is concerned that policymakers are generally slow in responding to changes in the economic cycle, because they don’t see the early signs of changing macroeconomic conditions. Hutchens explains how application of Sahm’s rule involves calculating the moving average of the change in unemployment over the last three months, and if that exceeds a threshold the economy has entered a recession. (His article explains the arithmetic in detail.) We are already close to that threshold.
Sahm’s concern is about getting monetary policy right, avoiding cycles of over-stimulation and excess restraint. Maybe if policymakers, in Australia and in other countries, had heeded early warning signs they may have pared back spending in the post-Covid-19 period, and maybe now they would be thinking of ways to stimulate the economy. John Hawkin’s Conversation, article, linked above, hints that Treasury is thinking of how to respond to recessionary conditions.
Getting the timing of macroeconomic measures right, be they fiscal or monetary, is a crucial aspect of stabilization policy. In this regard JK Galbraith, many years ago, floated the idea that the rate of unemployment benefits should be mathematically linked to the unemployment rate – a mechanism that would kick in quickly and without political argument. It was largely ignored in the postwar era where unemployment was seen to be a thing of the past, but as Hutchens explains, staff of the Reserve Bank are looking at unemployment dynamics and have developed their own versions of Sahm’s equations.
A similar concern for macroeconomic stability is expressed by Ian Verrender in his article on the ABC website: Did the Reserve Bank hit the brakes too hard? Why Australia's economy is heading into reverse. OK – the sub-editor may have overstated the situation in the headline, posted a day before the national account figures, but there are signs that the RBA may have overshot.
There is evidence, from Australia and around the world, that monetary authorities do tend to overshoot, because they don’t understand the dynamics of systems with lagged but large responses to small stimuli. (Think of getting the temperature right in the shower in a hotel.) The dynamics of control systems, involving tertiary level mathematics, is pretty well standard fare in engineering courses: that’s why the cruise control in your car works. But it’s a branch of high specialization in economics.
Undoubtedly there are economists among the RBA staff who have a good understanding of system dynamics, and we would expect the Governor, Michelle Bullock, to be well-versed in the theory. But we don’t know whether the staff can transmit their knowledge to the board. There are vacancies on the RBA interest rate setting board: it would be wise for the Treasurer to consider candidates’ competencies in control systems. Perhaps he might even look for an engineer or two.
Wages-profit share
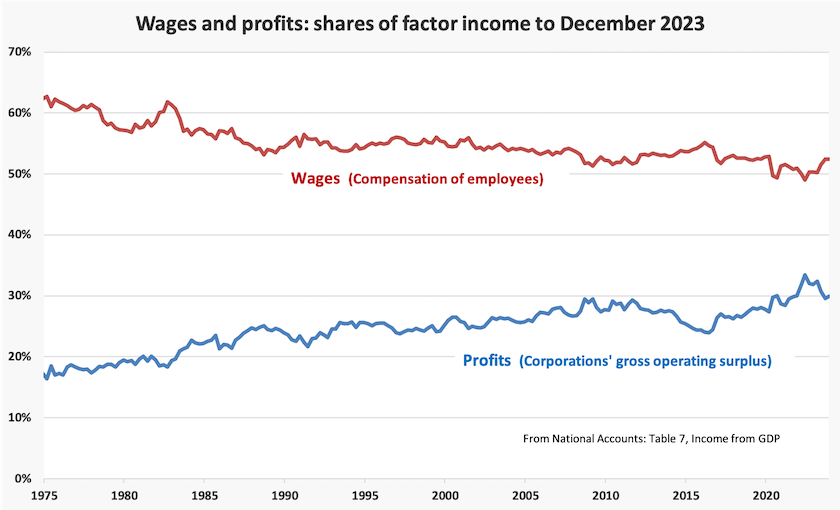
In the December National Accounts, the wage and profit shares of GDP remained unchanged, at 52 percent and 30 percent respectively. That wage share is still below where it was between 1990 and 2015 (around 55 percent) and in the 1970s (around 60 percent).
Productivity
It’s hard to say much about productivity trends when we are still getting over the pandemic.
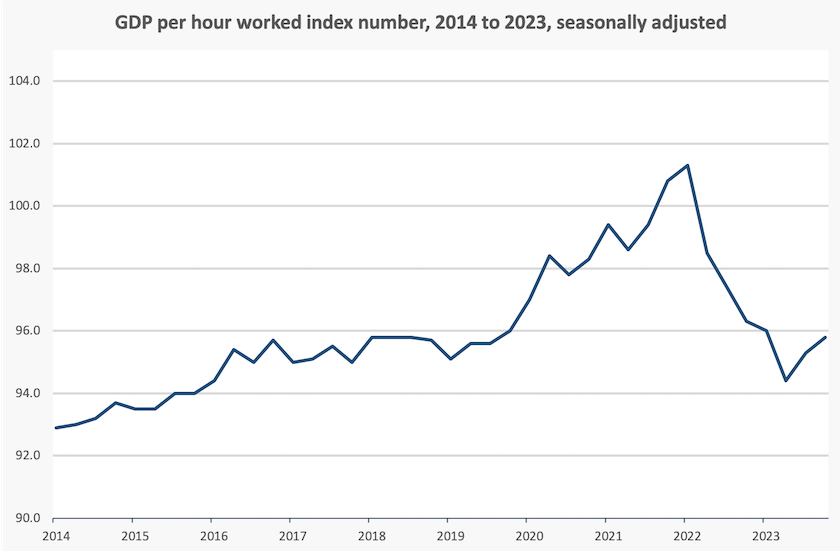
National accounts reveal that productivity, as indicated by GDP per hour worked, rose by 0.5 percent in the December quarter, but that needs to be seen in the broader context of the effect of the Covid-19 pandemic, which involved large shutdowns in 2020.
The graph below is more a story about the pandemic than about the basic question of productivity – whether we are working smarter. As the pandemic took hold working hours dropped dramatically, and as is usually the case in any recession, the most productive workers and the most highly-paid workers (not necessarily the same group) tended to hold their jobs. So mathematically GDP per hour work rose. As we made our way out of the recession the reverse happened. Recent small rises in GDP per hour worked are welcome, but they take us back only to the levels in 2017 and 2018.
The GDP per hour worked indicator reported in the national accounts is a rough (but timely) indicator of productivity. Every year the Productivity Commission reports on annual productivity developments, and their 2024 productivity bulletin, covering 2022-23, shows the same Covid-19 effects: it’s too early to distinguish between the trend and the noise of Covid-19.
The Commission did, however, find two negative developments that are probably not closely pandemic-related.
One is that employment grew faster than capital per worker. To quote the Commission:
Employment growth easily outpaced capital deepening in 2022-23. So while a record number of Australians had jobs, employers didn’t invest in the equipment, tools and resources that are needed to make the most of employees’ skills and talents. Further capital investment would help turn our strong employment growth into strong productivity growth.
The other development it detected is that while productivity has been falling, employees have been disproportionately bearing the cost of that fall. Much of this stems from price changes in the mining sector: rises and falls in commodity prices are to do with volatile world markets rather than any change in physical productivity. But for the rest of the workforce the same phenomenon, known as “wage decoupling” was in effect, as it has been for many years. To quote again:
Wage decoupling for the rest {non-mining] of the workforce is 0.18 percentage points per annum since 1994-95. The fall in wages over 2022-23 for the rest of the workforce (4.6%) exceeded the fall in labour productivity (3.5%).
It will be some time before the effects of the pandemic will be smoothed out, and even longer, perhaps, before we see any improvement in productivity as the economy recovers from the misguided economic policies of the nine years of Coalition government. But these findings from the Productivity Commission appear to confirm that the Coalition’s policy of driving real wages down, supported by their tax changes that discouraged long-term investment, have been effective.
What will happen to interest rates?
Most economists expect that at its next meeting, on March 19, the Reserve Bank Board will announce a four percent reduction in the cash rate, accompanied by an apology for its excess zeal in its 13 increases over the last 22 months.
Just kidding.
John Hawkins and Craig Applegate of the University of Canberra bring some reality to our expectations in their Conversation article Interest rates are expected to drop but trying to out-think the market won’t guarantee getting a good deal.
While some economists expect rates to hold steady, or perhaps to rise, most expect there to be some modest falls, starting later in this year. As has often been stressed in these roundups (but not in most media), the real interest rate – the interest rate after inflation – has been zero or negative for most of the last ten years. Hawkins and Applegate go into some detail about the RBA’s target for a real interest rate, and it turns out to be somewhere around 1 percent. So if inflation is 2 to 3 percent (the RBA’s target), the nominal rate would be somewhere between 3 and 4 percent – not much down from the present 4.25 percent. A long period of low interest rates appears to have shifted our notion of what constitutes a “high” rate.
Although Hawkins and Applegate don’t mention it, much of the CPI inflation and housing price inflation we have experienced in recent years results from the long period of unjustifiably low interest rates.
Hawkins and Applegate also dampen expectations that if interest rates fall, rents will fall. High rental prices result from a market supply-demand imbalance, not from high interest rates.