Economics
National accounts – unexciting but reasonably solid
The GDP figures released on Tuesday confirm that there is still a backlog in structural reform and that the path to improved productivity is a long one.
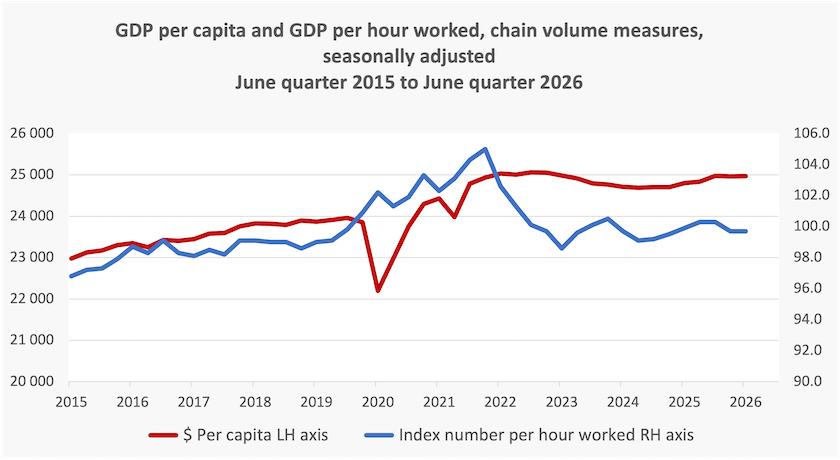
The good news in the GDP figures, released on Wednesday, is that GDP over the 12 months to June this year rose by 2.1 percent. That is a little faster than our population growth, which means GDP per-capita, the more meaningful indicator of prosperity, rose by 0.7 percent over the year.
The bad news is that GDP per hour worked – a rough but basic indicator of labour productivity – fell by 0.2 percent over the year.
These are shown in the graph below.
Another indicator revealed in the GDP figures is that the GDP chain price index, an economy-wide index of inflation, fell by 0.6 percent over the June quarter, and has risen by only 2.8 percent over the year, well inside the Reserve Bank’s two to three percent inflation comfort zone. If the RBA were guided by the GDP chain price indicator to the same extent that they are guided by the CPI, they would take a break and stop sending their alarmist signals about impending rises in interest rates. The GDP inflator has its imperfections, particularly its use of shifting weights, but the CPI too has its imperfections, including its use of fixed weights that tend to overstate inflation because they understate the benefits of substitution.
In any event we can be sure the RBA, subject to an extreme case of the confirmation bias, will look at these figures forensically to find evidence of an overheating economy. For example they might note that much of the growth in this quarter’s GDP is in discretionary consumption, a signal that some households are living comfortably. That violates their ideal of an economy constrained by the dead hand of austerity.
A summary of the main aspects of the national accounts is in a Conversation contribution by John Hawkins and Stephen Bartos of the University of Canberra: Australia’s economy grows by 2.1%, but people’s living standards aren’t keeping pace.
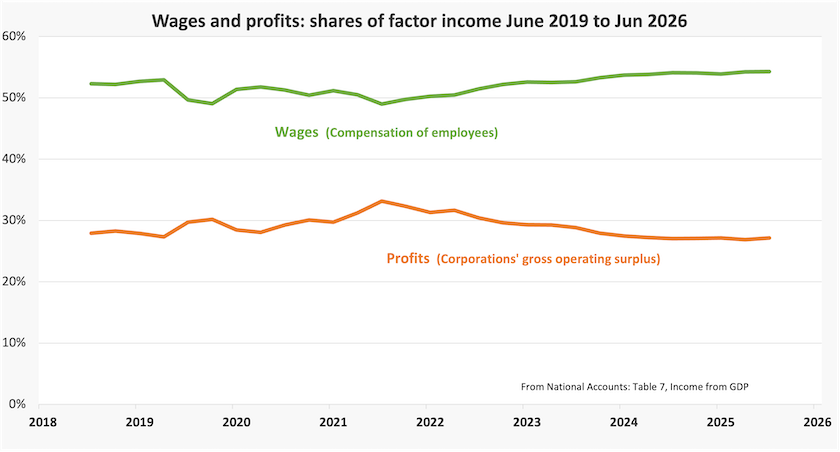
One series followed in these roundups is the distribution of income between wages and profits, revealed in each quarter’s national accounts. The long-term story is that over the last 50 years the share of national income going to profits has increased while the share of income going to wages has fallen. This has been in line with the enduring policy of Coalition governments to suppress wages, particularly at the lower end of the scale. The peak profit share was during the Covid pandemic, when the Morrison government used the “Jobkeeper” program as a means of keeping companies afloat – in fact not only afloat, but also extremely profitable. Since then the present government has been mildly successful in tilting the share back to wages as shown in the graph below.
Australians’ disposable income remains essentially flatlined, but it is roughly where it would be had the pre-pandemic trend continued.
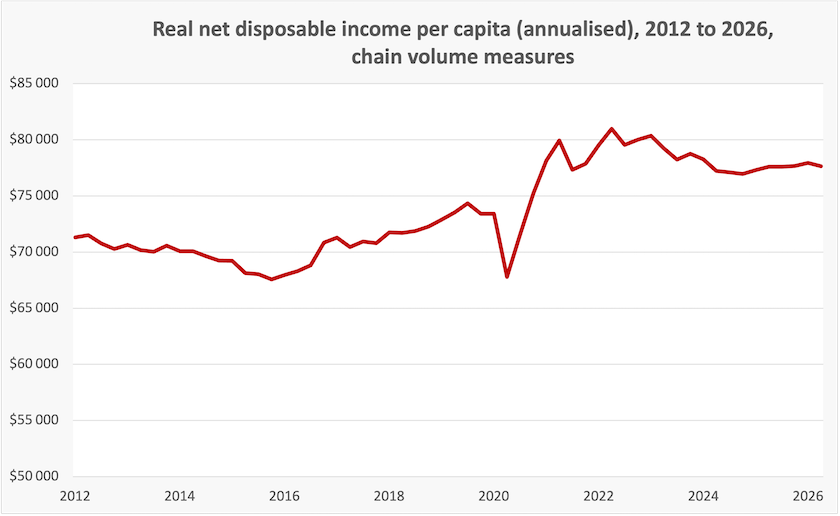
Importantly this series is an indicator of income before mortgage and other repayments are deducted. In about 33 percent of households a mortgage is being paid off, and even in rented properties over-leveraged property owners are passing interest costs on to tenants. In such households what they see as “disposable” income – money left in their bank account after all deductions, rather than the economists’ use of the term (what’s left after tax) – has taken a hit.
Some may be surprised that national accounts show that disposable income has risen, while well-documented work by the Australia Institute demonstrates that real wages fell sharply between 2020 and 2023, and are now no higher than they were in 2012.
There isn’t a contradiction, because incomes have risen while wages haven’t. ABS labour force data shows that labour force participation has risen, roughly from 65 percent to 67 percent. That is, Australians are sustaining their incomes by working more. And wages aren’t the only source of income. Wealthy retirees living off interest and dividends, property speculators enjoying (up to now) tax breaks on negative gearing and capital gains, and pampered small businesspeople using family trusts, have all been enjoying non-wage income.
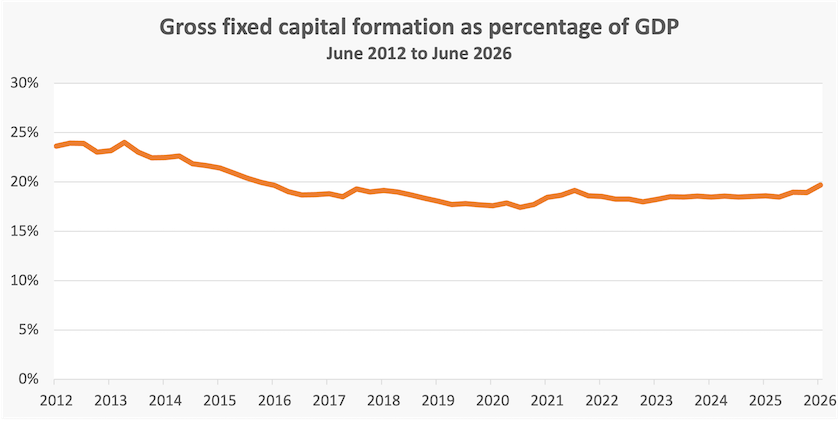
The government has drawn attention to a growth in capital investment, shown in the graph below. It’s a small recovery from the steep fall during the time of the Abbott and Morrison governments. Normally a boost in capital expenditure is a leading indicator of a pickup in labour productivity, but if that boost is simply in the construction of data centres that will employ very few people, the improvement in productivity may not eventuate.
The broad picture confirmed by these national accounts is of an economy severely weakened by many years of neglect as successive governments, mainly Coalition, confined economic management to fiscal theatre about spending levels and deficits, rather than addressing the need for structural change. If there is criticism to be levelled at the Albanese government it is for being tardy and excessively risk-averse, in undoing the damage inflicted by the long years of Howard’s economic indolence – for example by taking three years before it got around to even minor repair of our taxation system.
But by world standards our figures are ones other countries would love to be enjoying.
Housing wreckage?
Media reports of a fall in the value of our houses are misleading, unless we have a strange idea about “value”.
“$40,000 wiped off the value of the average house over winter” reads a headline in the Sydney Morning Herald and The Age.
That’s unexpected. It’s been a warm winter with around average rainfall: the big damage to houses usually comes in summer when we can be hit with floods, fires and the occasional tornado. There’s no evidence of a plague of termites or of rats eating electrical insulation. Our houses may have worn a little over winter but in our spring clean we can replace that broken hinge, apply touch-up paint in spots, change a leaking tap cartridge. All up $100 perhaps, but where does that $40 000 come from?
If we read Shane Wright’s article, rather than the alarmist headline some sub-editor attached to it, we see that it’s about the average market value of our houses. That refers to the half-million or so houses that go on the market every year, rather than the 11 million that don’t change hands. Wright has drawn on Cotality data, showing that on average, the market value of houses sold in June, July and August fell by 3.1 percent over those three months. Because CPI inflation is running at about 1.0 percent a quarter, that suggests a real fall of about 4 percent over the quarter. Prices are falling in all state capitals, particularly Sydney and Melbourne, and in most of the rest of Australia.
That data confirms that house prices have probably reached their turning point and are now on their way down. (The dynamics of the market were covered in the roundup of 22 August.)
Those who have recently bought houses will have buyer’s regret, but the real losers will be over-extended property developers with partially-completed projects. In this regard the plight of Sydney developer Bathla has been gaining a great deal of media cover.
That problem relates to the way large parts of the industry is financed, with a small amount of equity and a large amount of debt – not only to institutional lenders but also to subcontractors and even employees. Such a heavily-geared financial structure works wonders for property developers when the market is rising, but the same powerful forces work with savagery in a falling market.
No one should shed a tear for property speculators who find that their magic pudding model of capital gains from ever-rising property values was flawed. Had they spent some time reading history or talking to people who had been in the game a long time, rather than listening to financial spruikers, they would have done something more sensible with their money.
Some speculators who have recently bought into the market and are now selling will find that while they have made a nominal gain on their trade, that gain has not kept up with inflation. Had the government not reformed the capital gains tax provisions, restoring the pre-Howard system, they would now find themselves paying tax on those nominal gains, but thanks to the government’s reforms they will pay no tax. But don’t expect to hear any gratitude from speculators or finance spruikers, who cannot bring themselves to part from the line that this dreadful Labor government has loaded investors with crippling new taxes.
The way politicians and the media is treating falling house prices is revealing. If the price of potatoes or gasoline were falling, the news about it would be in positive terms. But experienced journalists, including the ABC’s most respected reporters, are presenting the fall in house prices as something problematic, and ministers, including the Treasurer, are embarrassed to admit that they want house prices to fall. Such is the way people’s thinking has been twisted by the commodification of housing. We buy houses to live in, not to trade or to gamble with.
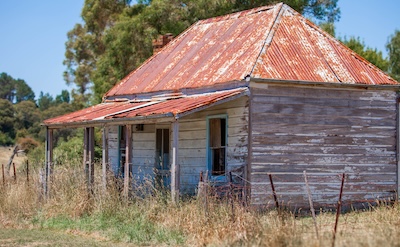
Renovator’s delight
Unsurprisingly, the real estate industry is squealing about the fall in house prices. Because they take their fees as percentage commissions they have a stake in high prices. And they benefit from turnover, particularly from “investors”: the young person buying a house to live in for the next ten or twenty years is a poor prospect. That explains their seething hostility to Labor governments, state and federal, who, in their view, have a misplaced concern for home buyers rather than for small businesspeople in the real estate industry profiting from a distorted market.
Their greed and contempt for home buyers is explicit in a realestate.com.au article: Melbourne house prices to surge in five key areas post-election, in which spokespeople for the industry openly express their hope that a Liberal or a Liberal-One Nation state government re-establishes a market favourable to property speculators and allows prices to rise out of reach to home buyers.
At least they’re honest about their self-interest.
To date the steepest falls in prices have been at the top end of the market, which so far is of little joy to first-home buyers, but those who know how the market works expect that falls are becoming more widespread.
For most Australians who have the good fortune to own or be paying off a mortgage, nothing has changed. Their houses are still providing shelter, amenity and a place in the community. Provided their owners attend to those small post-winter repairs, their value is holding, and if lower prices help others become home owners, more people will share in that benefit.
Getting gas companies to pay their way
There is argument about how we should ensure gas companies pay for the gas they extract, but there is agreement that they should pay for those resources.
People understand royalties. Water, forests, iron ore and other natural resources and companies using those resources should pay for each litre of water, each cubic metre of wood, and each tonne of iron ore they use. These charges were expressed as royalties relating to standard quantities.
But then came along the economists and argued that royalties should be replaced by resource rent taxes. The idea was that because some resources are harder to extract than others royalties make it uneconomic for companies to use those harder-extracted resources. So the economists’ model is essentially one with varying royalties, but rather than setting specific rates, they would tax excess profits – “rents” in economists’ jargon. With the aid of a whiteboard and the discipline of a closed-book exam it is possible to convince that a resource rent tax is superior for all parties than a royalty, but in simple terms it means that a mine, for example, will keep operating as lower standard ore is dug up.
Therefore it looks like heresy when an economist argues for a reversion to royalties as a way of taxing gas exporters, but that is what Diane Krall of Monash University does in her Conversation contribution Richard Denniss is calling for a gas export tax, but an effective royalty system would be a better option. Her reference to Richard Denniss is about his proposal to collect a 25 percent tax on gas exporters, described in his book More fool me: how the gas industry tricked Australia.
Krall’s argument is that the 1988 decision by the Hawke government to apply a resource rent tax on petroleum products made sense for liquid fuels, but for the gas industry, dealing with more dispersed reserves, it allowed companies to claim as deductible expenses large amounts spent on exploration, which they are still carrying through as losses. She is also critical of Denniss’s idea of confining a new tax to exports; gas producers should pay for gas extracted for the domestic market as well.
This is an argument about how to get the industry to pay for the gas it extracts from our land. Krall and Denniss are of the same view that we are not getting a fair return from gas companies.
What are we complaining about?
A short reflection on our material standards of living.
Every now and then the Economist publishes the Big Mac Index, showing what a Big Mac would cost if its price in local currency were converted to $US at the prevailing official exchange rate. The Big Mac Index is so famous that it even has its own app. As such it’s a crude but cute indicator of whether a country’s currency is over or under-valued in relation to the $US. For a long time the index suggested the $A was undervalued, but now it is about neutral.
In August, probably as a one-off, the Economist has produced an index showing how many Big Macs a “typical worker” could buy with an hour of their earnings. It’s a crude indicator of how much it costs in each country to “put food on the table” to use the old-fashioned term resurrected by the ABC.
Unfortunately the post is securely paywalled, but a few bits of data can be quoted.
Out of the 32 OECD countries surveyed, Australia comes in at third position, behind the USA and Switzerland. Americans can buy 10 Big Macs with an hour’s pay, and we can buy 9. But for the other 29 countries affordability falls away quickly. The British can afford 6 Big Macs, the French 5, and the Germans only 4.
OK – the Swiss probably don’t eat many Big Macs, but the index’s creators suggest that with its mix of ingredients and labour inputs a Big Mac is a first-order proxy for a standard basket of food resources. We and the Swiss do pretty well.
That’s about Australia compared with other countries. Besides comparing our living standards with the living standards in other countries, we can look at how they have improved over time.
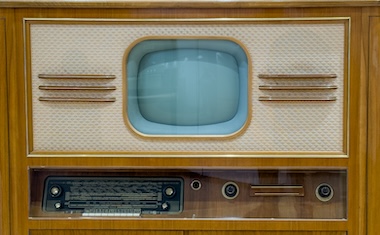
The luxury of home entertainment
Joe Walker has brought to our attention a website Ordinary Abundance, showing how goods once considered to be fanciful have become everyday household items. For each twenty or so items there is a quote from the past by some dreamer who envisaged where technology might take us. For example, the first quote is from Edward Bellamy in 1888:
If we could have devised an arrangement for providing everybody with music in their homes, perfect in quality, unlimited in quantity, suited to every mood, and beginning and ceasing at will, we should have considered the limit of human felicity already attained.
Other luxuries dreamt of include inside water on tap, lighting without flames, and toilets that didn’t require an outdoor exposure to the elements.
A revealing thought experiment is to imagine explaining our “cost of living crisis” to a visitor from another century and another country. If that is too challenging, perhaps we could imagine the same conversation with our parents or grandparents, depending on our age.